The national number, and why it misleads
The U.S. Energy Information Administration's Electric Power Annual for 2024, published 1 December 2025, reports that U.S. electricity customers experienced an average of eleven hours of electricity interruption that year. That was the most in a decade — nearly twice the annual average of the preceding ten years.
Taken alone, that number is close to useless for planning, because it is an average across two completely different kinds of event.
Two different outages hiding in one average
| Category | 2024 average | 2014–2023 average | What it is |
|---|
| Non-major-event | About 2 hours | About 2 hours | Trees, failed transformers, vehicles into poles. Minutes to a couple of hours. |
|---|
| Major event | Nearly 9 hours | Nearly 4 hours | Hurricanes, ice storms, wildfires. Days, concentrated in a few regions. |
|---|
| Total | 11 hours | About 5.5 hours | The headline figure |
|---|
Source: U.S. Energy Information Administration, Electric Power Annual 2024. Hurricanes Beryl, Helene and Milton alone accounted for 80% of all outage hours nationally in 2024.
The non-major-event figure is remarkably stable at around two hours a year and describes the everyday experience of most households: a handful of brief interruptions, no consequences.
The major-event figure is where the whole backup-power decision lives. It more than doubled between the 2014–2023 average and 2024, and it is not distributed evenly — it lands on particular regions in particular years.
The state spread is the real story
In 2024, customers in South Carolina averaged nearly 53 hours of interruption — the highest of any state, driven by Hurricane Helene's winds and flooding damaging transmission, distribution and substations across the Carolinas and Florida.
In the same year, customers in Arizona, South Dakota, North Dakota and Massachusetts averaged under two hours in total.
Fifty-three hours against under two. Those two households should not buy the same equipment, and the national average tells neither of them anything useful.
Finding your own number
Fifteen minutes, and it is worth more than every product review on this site.
- Search your utility's name plus “SAIDI” or “reliability report”. SAIDI — the System Average Interruption Duration Index — is the average minutes of interruption per customer per year. Utilities report it to regulators and most publish it.
- Check your state utility commission. Regulators publish comparative reliability data across utilities, often broken down by service territory.
- Read both versions of the figure. Utilities report SAIDI with and without major events. The gap between the two is precisely the storm risk you are deciding whether to insure against.
- Ask a long-standing neighbor. Genuinely useful. SAIDI is a territory-wide average; a rural feeder at the end of a long line behaves very differently from an urban one, and someone who has lived on the street for a decade knows which yours is.
Two things SAIDI does not tell you
The distribution. Eleven hours could be eleven one-hour outages or one eleven-hour outage, and those are different purchases. The companion metric, SAIFI — frequency rather than duration — helps, and dividing SAIDI by SAIFI gives an average outage length that is more informative than either alone.
Your specific circuit. Averages hide enormous variation within a territory. If your street is at the end of a rural feeder with overhead lines through trees, you are on the wrong side of that average.
Why outages are getting longer
The 2024 figure was the highest in a decade, and the major-event component more than doubled against the preceding ten-year average. The EIA attributes the 2024 spike specifically to hurricanes Beryl, Helene and Milton, which together caused 80% of the national outage hours.
What we will not do is extrapolate a trend from that. One severe hurricane season is not a trend line, and forecasting future grid reliability is well outside what published data supports. What the data does support: major weather events are what produce long outages, and where you live determines your exposure to them. That is enough to size a purchase.
Turning your number into a purchase
Once you know roughly how long your power is off, the equipment decision is nearly automatic:
- Under 4 hours: nothing, or a small battery for the router and lights. A sealed fridge is safe for four hours on its own.
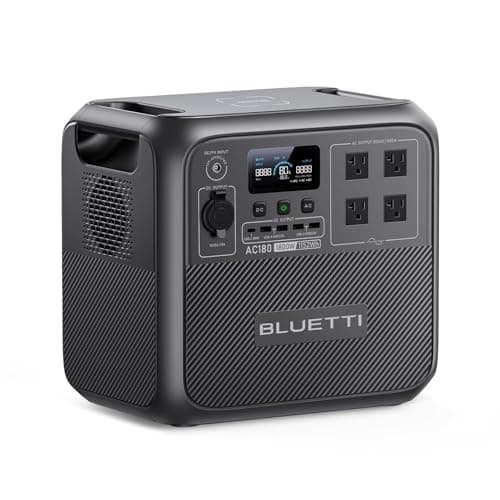
- 4–14 hours: a 1,000–1,200Wh power station with an 1,800W inverter.
- 1–3 days: a generator, or a large battery with solar.
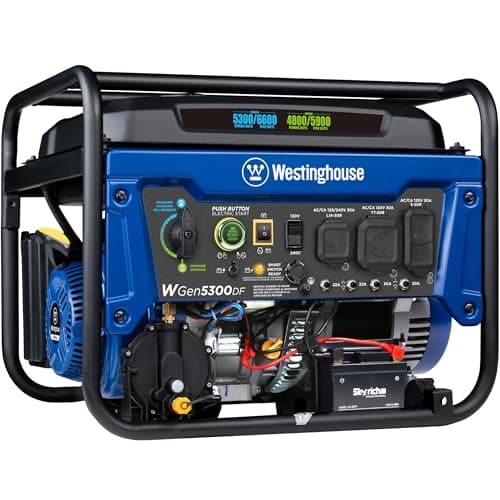
- 3+ days, repeatedly: a dual-fuel generator with a transfer switch, or a standby installation.
The full duration-to-capacity mapping is here, with the arithmetic behind each row.